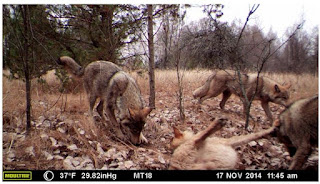
30 years after Chernobyl, UGA camera study reveals wildlife abundance in CEZ
Concepts of Thinking: Spatial Significance, Interrelationships, Patterns and Trends
Inquiry: How have these animals been able to survive with the increased levels of radiation in their habitat? How likely is I that humans will be able to thrive with the increased radiation rates?
Activity: Map the Chernobyl nuclear power plant location. Determine level of contamination by creating buffers to show the range of contamination. Add population data and other relevant data to make predictions for how long before the land might be safe for people to go back to a "regular" routine in the area.
Additional info
Additional info


No comments:
Post a Comment